In December 2019, there were 265,000 licensed EVs on Britain’s roads, equating to 6.3% of total new car registrations in the UK. In fact, over 72,700 electric vehicles were sold in the UK in 2019 – an increase of 21.8% compared to 2018’s stat of 59,700.
The Government’s Road to Zero strategy highlights the aim of by 2040, for 50-70% of new car sales, and 40% of new van sales to be “ultra-low emission”; and from 2040 onwards, only cars with zero emissions able to be sold.
The Business, Energy, and Industrial Strategy Committee stated that this aim was vague and unambitious. Instead, they argued that the UK should be aiming for every single new car and van being sold by 2032 onwards, to genuinely be zero-emissions.
However, for this to be achieved, consumer appetite for electric vehicles would have to grow by an incredibly ambitious 17,000%.
As a result, we decided to identify which cities in the UK were the best equipped for electric vehicle owners – and which cities had room for growth.
In order to gather statistics for our index, we analysed the Department for Transport’s vehicle licensing statistics, and the number of EV chargers in each city. With this data, we were able to calculate how many electric vehicles there were in each city, for every charger. The results were interesting…
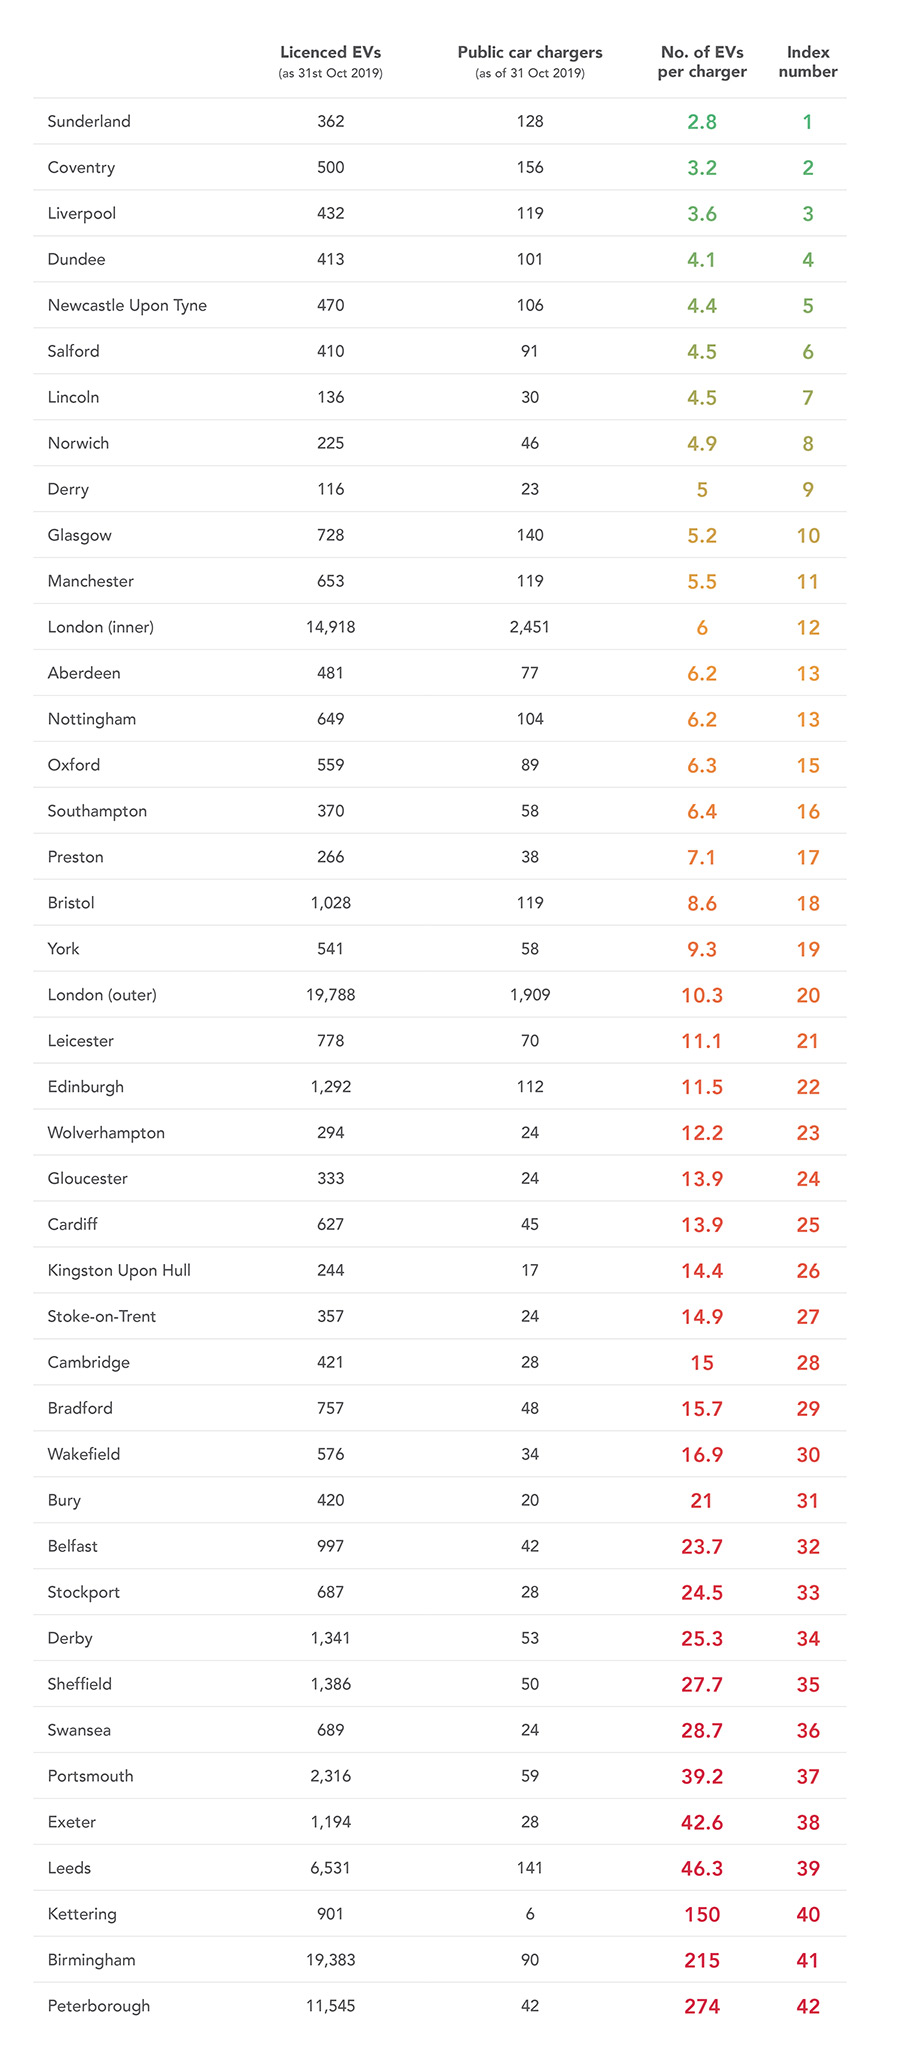
The top ten cities, with the lowest car-to-charger ratios were:
- Sunderland: 2.8 electric vehicles per charger
- Coventry: 3.2 electric vehicles per charger
- Liverpool: 3.63 electric vehicles per charger
- Dundee: 4.08 electric vehicles per charger
- Newcastle Upon Tyne: 4.43 electric vehicles per charger
- Salford: 4.5 electric vehicles per charger
- Lincoln: 4.53 electric vehicles per charger
- Norwich: 4.89 electric vehicles per charger
- Derry: 5.04 electric vehicles per charger
- Glasgow: 5.2 electric vehicles per charger
The ten cities with the highest car-to-charger ratios were:
- Peterborough: 274.88 electric vehicles per charger
- Birmingham: 215.36 electric vehicles per charger
- Kettering: 150.16 electric vehicles per charger
- Leeds: 46.31 electric vehicles per charger
- Exeter: 42.64 electric vehicles per charger
- Portsmouth: 39.25 electric vehicles per charger
- Swansea: 28.7 electric vehicles per charger
- Sheffield: 27.72 electric vehicles per charger
- Derby: 25.3 electric vehicles per charger
- Stockport: 24.53 electric vehicles per charger
What does this mean?
We didn’t want our index to highlight the ‘worst’ cities – instead, we’ve merely shown that the cities falling on the lower half of the spectrum have more room for improvement.
If the government wants to encourage more people to purchase EVs in the future, there are several things it must do to make that happen. One of those things is to ensure that there is an adequate number of chargers in each city. For example, Peterborough only has 42 chargers available for 11,545 electric cars – therefore, if a driver needs to charge their car whilst in a public place, there’s a high probability they’ll be unable to.
And, with a survey showing that 50% of young people in the UK would like to own an electric car – compared to just 25% of their parents – this shows the government that the appetite is there, they just need to remove any obstacles in the away. By doing that, they are making their Road to Zero strategy become more reasonable to achieve.
If you have any questions about our services, please get in touch with us today. Full methodology can be found here.